Regression to the mean in health care describes the tendency of the symptoms of a condition to go back to an average state after it has run its course in one extreme. Various academic fields have similar definitions of regression to the mean, such as in psychology and philosophy.
For example, if you have extreme low back pain, then it’s likely that your pain will reduce—or regress—to your “normal,” whatever that may be. It may be mild pain or no pain at all.
If the pain eventually reduces on its own, almost any type of intervention—even bogus treatments—may seem to be “effective.” This is a factor to consider in understanding how and why treatments work or not.
First, you’ll often hear regression to the mean in discussions on how to evaluate research. This means knowing how to tell the difference between good research and flawed research, which helps us understand what good research tells us about how the natural world works in reality and how we can use that knowledge for our clients’ benefit.
In turn, your clients can trust you to tell them the truth and to carry out your professional responsibility to put their interests ahead of yours. This way, they can make solid healthcare and treatment decisions grounded in autonomy and informed consent.
What does regression to the mean mean?
Regression means “going back,” and mean means “average.” This is where measurements that were extraordinarily high or low at first return to more typical values in a later measurement, or where measurements that were average at first are extraordinarily high or low in a later measurement.
Let’s look at an imaginary yet plausible example. Ten participants in a study are asked to report on a scale from 1 to 10 how much pain they are experiencing. Here’s the data for their first report.
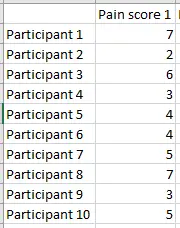
We can calculate the mean (average) pain score for this group, and it turns out to be 4.6. Now we can graph how far away each participant in the study is from the group average.
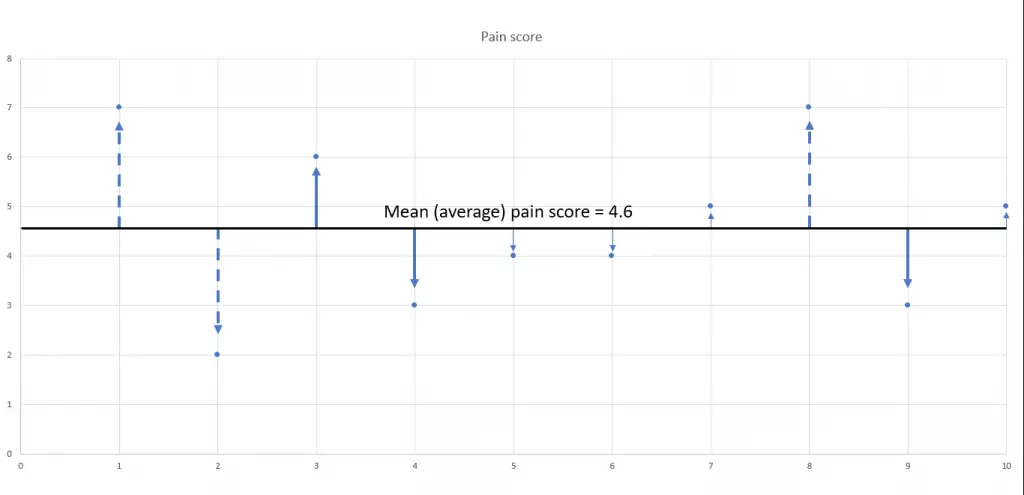
Participants’ pain scores indicated by the thin arrow (5, 6, 7, 10) are very close to the group mean pain score. Participants’ pain scores indicated by the thick solid arrows (3, 4, 9) are a little further away from the group mean, and participants’ pain scores, indicated by the dashed arrows (1, 2, 8), are the farthest away from the mean.
The researchers measure the participants’ pain scores again, and the new results are listed beside the previous results:
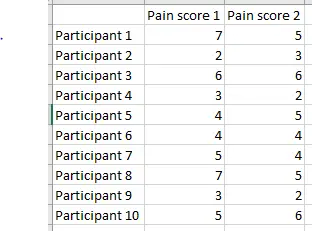
We can graph these pain score values as well (brown points) and compare their distances from the mean with those of the original results (blue points). Remember, the only thing that has changed is that the pain score was measured again—there was no intervention or treatment carried out.
For participants 1, 2, and 8, the brown point is closer to the mean than the blue, meaning that the second measurement demonstrates regression to the mean. They got there in different ways—participants 1 and 8 report a decrease in pain while participant 2 reports an increase.
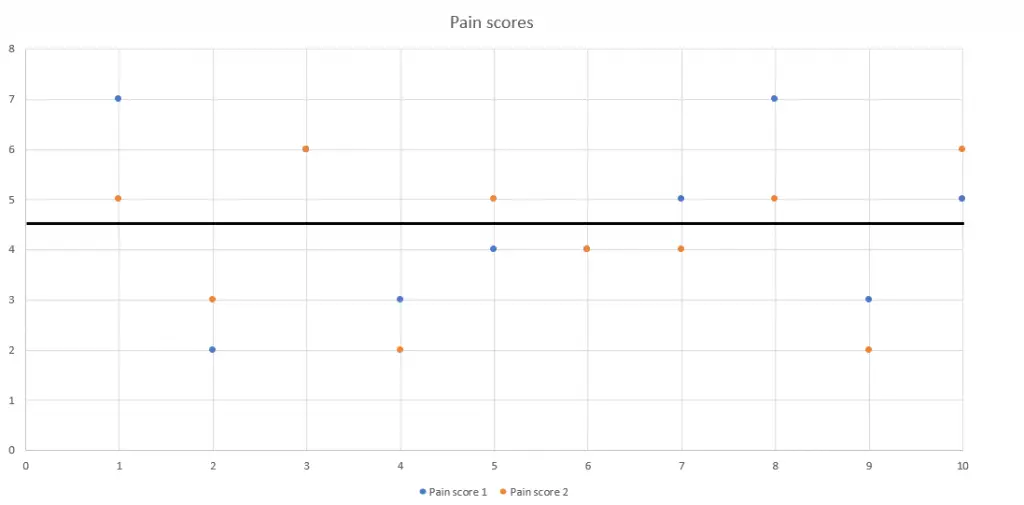
For participants 4, 9, and 10, the second pain score (brown) is further away from the mean than the original (blue), meaning less pain than before for participants 4 and 9, and more pain for participant 10—again, without any intervention or treatment.
For participants 3, 5, 6, and 7, their second pain scores are almost or exactly as close to the mean as their previous pain scores were.
Participants 3 and 6 reported no change at all, which is why you see only one point for each of them—the brown second point printed right over the original blue point.
Participant 5 reported an increase in pain, and participant 7 reported a decrease in pain, but—in comparison to the group mean pain score—these changes were not extreme.
Although this example of regression to the mean is imaginary and is designed to make it more relevant to the outcomes we and our clients care about, the data is plausible. Real-life examples can be found in every field of human endeavor from baseball to finance.
Regression to the mean in research
Some researchers identified three categories of non-specific effects that interact with treatment and healing:
-
- The natural course of the disease
- The regression of the symptoms to their mean
- Placebo response
The third category, “placebo response,” where improvement is observed after an inactive treatment, is perhaps the most well-known. Their first category, the effects of natural history of the disease (many conditions just get better over time with or without treatment), is also an important one, often overlooked in manual therapy research.
Their second category is what we’ll examine.
While reading research, if you understand that:
- Results that look dramatically improved (or worsened) the first time they are measured can look much more ordinary (or average) the next time they are measured;
- Results that look ordinary the first time they’re measured can look dramatically improved (or worsened) the next time they’re measured;
These changes can happen for reasons that have nothing to do with the intervention being studied (in our case, this intervention is massage therapy).
Regression to the mean in massage therapy
Many healthcare professionals in other fields grapple everyday with the problem of trying to distinguish real therapeutic effects from non-specific effects that introduce confusion over what treatments really work and why they work.
Think about the exercise we just went through with the pain-score data. We saw changes in pain scores (improvement as well as worsening of pain, sometimes dramatically so). That exercise is exactly what we would do if we were looking at a massage therapy study to see if it decreased pain scores, and those changes are exactly the changes we would look for to see if massage therapy helped.
The problem here is that the changes occurred in the total absence of massage therapy or any other intervention or treatment. That’s where the potential for confusion comes in.
Regression to the mean is an ordinary occurrence. It can, however, look exactly like a treatment effect, and we may not be able to tell the difference between the perception of a treatment effect versus the reality of no treatment effect. If you take the change at face value, you will think that massage had an effect that it really didn’t have.
If we’re taken in by the perception and get the substance and reality of what actually happened wrong, then we can provide invalid information to clients. In turn, clients—who trust us to get this right—are basing their healthcare decisions on the bad information we give them with the potential of causing suffering and financial harm to them.
Study designers should take regression to the mean into account and design accordingly, but the word “should” is doing a lot of work since researchers don’t always do everything they should do. It’s their job to demonstrate to us that they did their work correctly, and it’s our job to be skeptical, to evaluate how well they carried out their work, and to withhold accepting their conclusions and their narratives until they credibly convince us that their work actually did what it’s meant to do.
As part of your evaluation, ask yourself whether the research you’re examining has adequately accounted for the effects of regression to the mean. If they explicitly address the issue, and explain how they’re avoiding confusion from that non-specific effect. And if their explanation is convincing and makes sense, then that’s even better. But most papers won’t address it, and so you have to think about what it would mean.
Further reading: How to Fact-Check Massage Therapy Research: 6 Things to Look for.
Takeaways
A good study design uses multiple points of measurement over a longer time frame rather than just two because the before and after in a small sample can be an example of nothing more than regression to the mean.
- Pay attention to individual variation, as these effects can get lost in averaging as well. Read the methods and the results sections carefully: They’re more important than the abstracts and narratives in the introduction and conclusions sections for understanding what’s really happening.
- Look for the presence of a control group because without it, you can’t tell what would have happened anyway in the treatment group, with or without the intervention.
- Remember that science is a system, and we use systems thinking to evaluate and apply it in real-world-practice. It’s not just random facts in isolation that we have to struggle to keep memorizing.
If we understand aspects of it, those parts are going to reinforce and be consistent with the rest of it. We don’t have to continuously keep starting over from scratch since they are coherent. We can build on and reuse knowledge we’ve already gained.
Part of the knowledge that healthcare professionals share is that research is not a vending machine. You don’t just feed a certain number of tokens in and wait for the right answer to pop out fully formed. Instead, you have to use what you know about the natural world to evaluate how good the research is, how trustworthy it is, and how likely it reached the right answer for the question it’s studying.
If you’ve read this far, and grappled with how intense and complicated and frustrating this material can be, then I want to recognize you for your commitment to learning more about how research works, both for the benefit of your clients and for the profession. Thank you for your dedication.
Author’s note: Huge thanks to Dr. Christopher A. Moyer who let me bounce ideas and questions about regression to the mean off him while I was writing this article. Any misunderstanding or error that may have crept in is totally on me, not on him.
First published in 2018. Updated, May 17, 2025.